Another first from Dutypoint
ScubaTank® is now the UK’s first
EPD-Certified Booster Set
Continue to Dutypoint
Reading and understanding pump curves is an essential skill for anyone involved in specifying any sort of pump. This article provides a ‘quick-start’ guide to getting your head around these important pieces of data.
As with any standard line graph, a pump curve has two axes: a horizontal (“X”) and a vertical (“Y”). On a pump curve, the horizontal (“X”) axis shows the flow rate through the pump and the vertical (“Y”) axis shows the head, which is sometimes referred to as ‘pressure’.
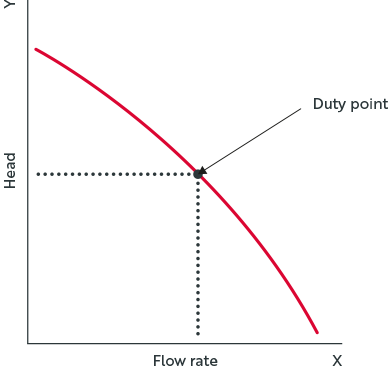
The curve indicates the pump’s maximum flow rate for any given head value or vice versa. Once you have worked out the maximum flow rate and head required in your application, you will be able to determine whether the pump you are looking at will be capable of satisfying your requirements.
You need to plot two lines: a horizontal line across from your required head value and a vertical line up from your required flow rate value. The point at which these lines intersect is called the duty point. Provided that the duty point is below the curve, as in the example above, you can be sure that the pump can satisfy your requirements.